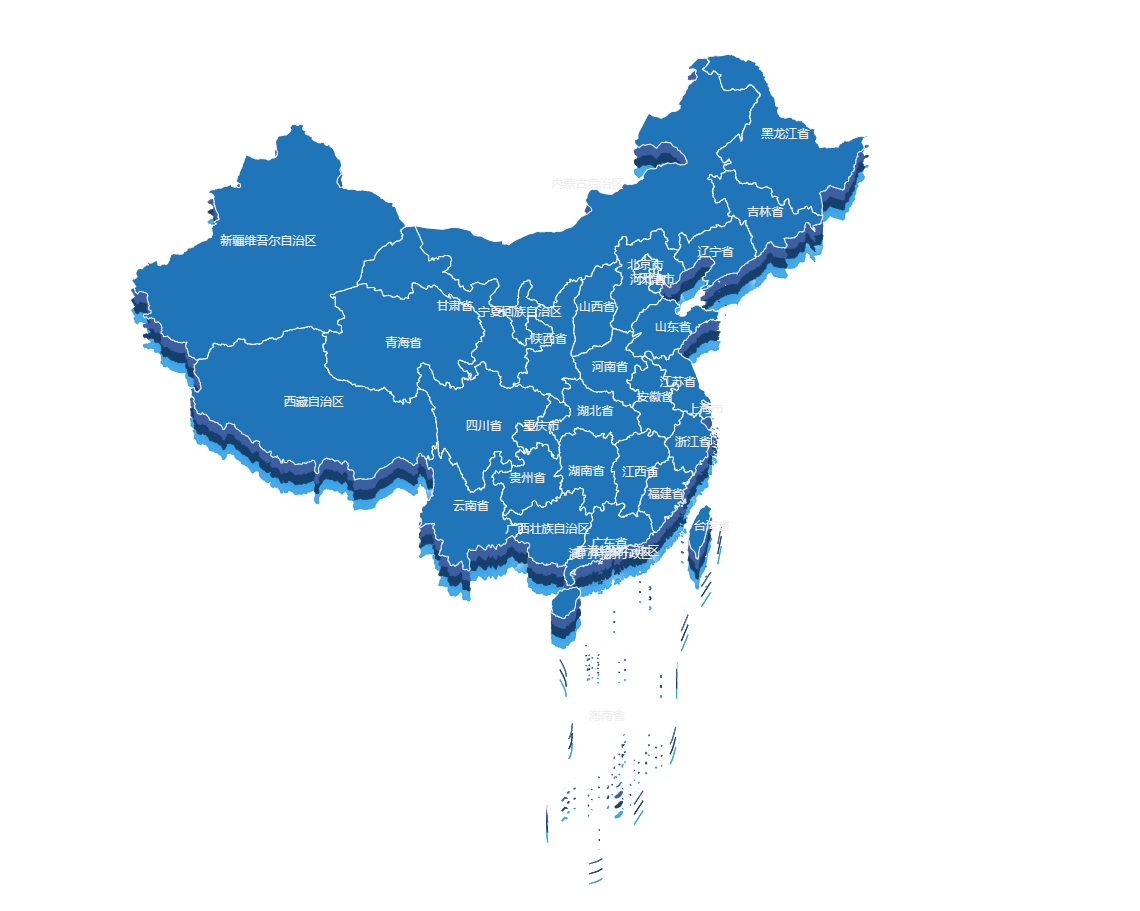
<template>
<div class="container" ref="appRef">
<div
id="myChart"
ref="myChart"
style="height: 1000px"
></div>
</div>
</template>
<script>
import { useIndex } from "@/utils/windowScale.js";
import sjz from "@/utils/nx.json";
export default {
data() {
return {
mapdata: [],
option: {
geo: [{
map: 'sjz',
zlevel:5,
label: {
show: true,
color: '#eee'
},
itemStyle: {
color: '#2075B8', // 背景
borderWidth: '1', // 边框宽度
borderColor: '#fff', // 边框颜色
}
},
{
map: 'sjz',
top:'11%',
zlevel:4,
itemStyle: {
color: '#3C5FA1', // 背景
borderWidth: '1', // 边框宽度
borderColor: '#3C5FA1', // 边框颜色
}
},
{
map: 'sjz',
top:'12%',
zlevel:3,
itemStyle: {
color: '#163F6C', // 背景
borderWidth: '1', // 边框宽度
borderColor: '#163F6C', // 边框颜色
}
},
{
map: 'sjz',
top:'13%',
zlevel:2,
itemStyle: {
color: '#31A0E6', // 背景
borderWidth: '1', // 边框宽度
borderColor: '#31A0E6', // 边框颜色
shadowColor: '#fff', // 外部阴影
shadowBlur:'10'
}
}
]
}
};
},
created () {
this.$nextTick(() => {
this.initCharts();
})
},
mounted() {
console.log(this.$refs.appRef);
const { calcRate, windowDraw } = useIndex(this.$refs.appRef.value, false);
calcRate();
windowDraw();
},
methods: {
initCharts() {
// 初始化
let myChart = this.$echarts.init(this.$refs.myChart);
// 注册地图
this.$echarts.registerMap("sjz", sjz);
myChart.setOption(this.option);
window.addEventListener("resize", function () {
myChart.resize();
});
},
},
};
</script>
<style lang="scss" scoped>
.container {
width: 1920px;
height: 1080px;
position: absolute;
// top: 50%;
// left: 50%;
// transform: translate(-50%, -50%);
// transform-origin: left top;
// transition: all 0.28s;
}
</style>
<template>
<div class="container" ref="appRef">
<