
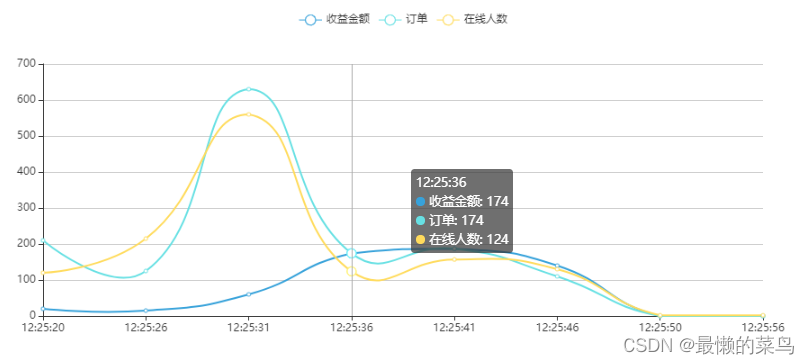
components文件夹下创建 TrendsSort.vue 文件
<template> <div id="myChart" /> </template> <script> import echarts from 'echarts'//引入echarts import { tv_update_TrendsSort } from '@/api/tv_manage/tv_manage'//这个自己封装好的接口文件 export default { name: 'TrendsSort', //获取父组件的数据,(没必要获取父组件的数据可以删掉) props: { temps: { type: Object } }, data() { return { // 实时数据数组 itme: [], price: [], order: [], see: [], // 折线图echarts初始化选项 echartsOption: { legend: { data: ['收益金额', '订单', '在线人数'] }, xAxis: { nameTextStyle: { fontWeight: 600, fontSize: 18 }, type: 'category', boundaryGap: false, data: this.itme }, yAxis: { nameTextStyle: { fontWeight: 600, fontSize: 18 }, type: 'value', scale: true, // boundaryGap: ['15%', '15%'], axisLabel: { interval: 'auto', formatter: '{value}' } }, tooltip: { trigger: 'axis' }, series: [ { name: '收益金额', type: 'line', smooth: true, data: this.price // 绑定实时数据数组 }, { name: '订单', type: 'line', smooth: true, data: this.order // 绑定实时数据数组 }, { name: '在线人数', type: 'line', smooth: true, data: this.see // 绑定实时数据数组 } ] } } }, //监听父组件传过来的值,判断是否开启定时器,(没必要获取父组件的数据可以删掉用mounted() 周期函数) watch: { temps(curVal) { this.myChart = echarts.init(document.getElementById('myChart'), 'light') // 初始化echarts, theme为light this.myChart.setOption(this.echartsOption) // echarts设置初始化选项 if (curVal.id === 0) { clearInterval(this.timer)// 关闭定时器 } else { // 开启定时器 this.timer = setInterval(() => { this.addData(curVal) }, 3000) } } }, //不需要父组件数据的用这个 // mounted() { // this.myChart = echarts.init(document.getElementById('myChart'), 'light') // 初始化echarts, theme为light // this.myChart.setOption(this.echartsOption) // echarts设置初始化选项 // setInterval(this.addData, 3000) // 每三秒更新实时数据到折线图 // }, methods: { // 获取当前时间 getTime: function() { var ts = arguments[0] || 0 var t, h, i, s t = ts ? new Date(ts * 1000) : new Date() h = t.getHours() i = t.getMinutes() s = t.getSeconds() // 定义时间格式 return (h < 10 ? '0' + h : h) + ':' + (i < 10 ? '0' + i : i) + ':' + (s < 10 ? '0' + s : s) }, // 添加实时数据 addData: function(curVal) { // 从接口获取数据并添加到数组(这是自己封装好的接口) tv_update_TrendsSort(curVal).then(response => { if (response.code === 200) { this.price.push((response.price).toFixed(2)) this.order.push((response.order).toFixed(2)) this.see.push((response.see).toFixed(2)) this.itme.push(this.getTime(Math.round(new Date().getTime() / 1000))) // 重新将数组赋值给echarts选项 this.echartsOption.series[0].data = this.price this.echartsOption.series[1].data = this.order this.echartsOption.series[2].data = this.see this.echartsOption.xAxis.data = this.itme this.myChart.setOption(this.echartsOption) } else { this.$message.error('出错了,折线图获取失败') } }) } } } </script> <style> #myChart{ width: 95%; height: 400px; } </style> <tem


